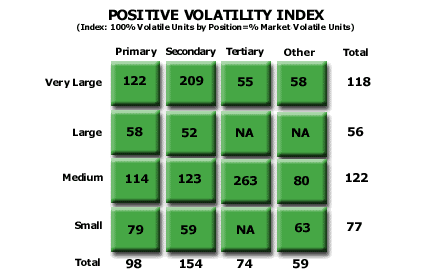
Analysis 19: Positive Volatility Index by Position
EXHIBITS:

| HOW TO INTERPRET THE ANALYSIS: This exhibit shows the Positive Volatility of each position on the Customer Size/Supplier Role Matrix compared to the Positive Volatility for the industry as a whole. For purposes of illustration, let us assume that the industry's overall Positive Volatility was ten percent per annum. This would mean that 10% of the unit volume in the industry changed suppliers during the course of a year. The exhibit is in the form of an index. The 10% industry Positive Volatility is indexed at 100. Using that index, we can see that the Very Large customers had a Volatility of 12.2% of their volume in their Primary role position. In other words, 12.2% of the total volume purchased by Very Large customers in their Primary roles changed suppliers during the course of a year. That 12.2% is an index of 122 (i.e., [12.2 divided by 10.0 equals 1.22] times 100 equals 122.). At the same time, Very Large customers, in their Secondary role purchases, shifted 20.9% of their total sales from one supplier to another. Both Very Large/ Primary Role and Very Large/ Secondary Role positions on the industry matrix were more volatile than the industry as a whole. On the other hand, the Large customers in their purchases from their Primary suppliers as well as their Secondary suppliers where less volatile than the market as a whole. The Large customers shifted only 5.8% of their total purchases in their Primary role and only 5.2% of their purchases in the Secondary role.
PURPOSE: This analysis quantifies the relative positive volatility of each segment on the size/role segmentation matrix compared to the market as a whole. Positive Volatility Index: Industry Examples » APPROACH: This analysis complements Analysis 18. It measures the positive volatility of a position on the customer size and supplier role segment as a percentage of the total (See Analysis 18). The company conducts the same analysis for the total industry. Total positive volatility for the position divided by total industry positive volatility multiplied by 100 creates this index. An index is a measure of the performance of one entity relative to another entity. The index is the ratio of the performance of the first entity divided by the performance of the second and then multiplied by 100. An index above 100 indicates that the first entity has a higher result than the second entity. An index below 100 indicates that the first entity has a lower result than the second. The resulting index enables the company to see how likely a size and role segment is to provide positive volatility volume compared to the overall market. An index above 100 indicates that the position has more positive volatility than the industry as a whole. An index below 100 indicates that the position is less volatile than the industry as a whole. For example, the Very Large secondary position on the customer size/role segmentation matrix offers roughly twice the rate of positive volatility that is offered by the industry as a whole. At the same time, the Large secondary position has a positive volatility rate only half that of the industry as a whole. Return to Diagnose Segments: Industry Volatility |
|
Recommended Reading |
| For a greater overall perspective on this subject, we recommend the following related items:
Analyses:
Symptoms and Implications: Symptoms developing in the market that would suggest the need for this analysis.
Perspectives: Conclusions we have reached as a result of our long-term study and observations.
|
