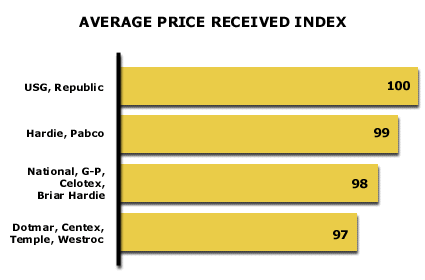
Analysis 48: Average Price Received by Competitor
EXHIBITS:

| HOW TO INTERPRET THE ANALYSIS: This exhibit arrays the average price received on a specific product, usually the Standard Leader product, by each competitor in a market. Each competitor's price is indexed to the two companies with the highest average price, USG and Republic. The remaining competitors in the marketplace price somewhat below those two companies with the lowest priced competitors offering discounts that average about 3% across the customers they serve.
PURPOSE: This analysis arrays each competitor by an index of his average price compared to other competitors who share customer relationships with him. The company will use this analysis to evaluate the relative growth and profitability of those competitors priced above or below it. APPROACH: Most markets have some spread in the average price charged by competitors. The industry leaders usually price at an index of 100. Occasionally, there will be a competitor priced at a slight premium of 1% to 5% over the industry standard. This is an unusual occurrence. On the other hand, a market where a few competitors price from 1% to 5% below the industry standard is quite common. We call these competitors "Price Shavers" since they are shaving their price in order to make up for some shortcoming as perceived by the customer group. This analysis categorizes each competitor by its pricing policy compared to the industry standard at 100. In each sampled customer relationship, the company with the Primary role is assumed to be at a price of 100. Other competitors in other roles in the customer relationship (e.g., Secondary and Tertiary suppliers) have prices that relate to the primary relationship holder's price. A Secondary supplier who offers a 2% discount would have an index of 98. A Tertiary supplier charging a 3% premium would have an index of 103. The index for each competitor is the average of his price indices with each sampled customer, weighted by the proportion the sales of each customer is of the competitor's total sales in the sample. Return to Diagnose Pricing: Price Sensitivity and Competition |
|
Recommended Reading |
| For a greater overall perspective on this subject, we recommend the following related items:
Analyses: Symptoms and Implications: Symptoms developing in the market that would suggest the need for this analysis.
Perspectives: Conclusions we have reached as a result of our long-term study and observations.
|
