Positive Volatility Index: Industry Examples
Positive Volatility Index: Industry Examples
| Industry Example #1 |
Market Positive Volatility Index
California Commercial Healthcare Market
(Positive Volatility Index by Position)
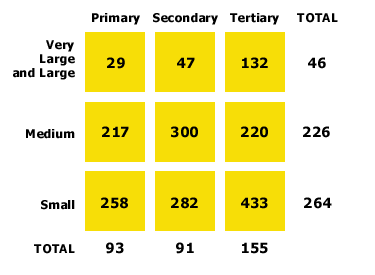
Explanation: For the market as a whole, the Primary and Secondary positions were less volatile than the Tertiary/Other positions. And, the Very Large and Large customers were less volatile than were the Medium and Small customers. If the industry had total Positive Volatility of 10%, then 10% of the total industry sales volume would have changed suppliers during the course of a year. Using the same hypothetical industry Positive Volatility of 10%, the example shows that Very Large and Large customers shifted 2.9% of their total purchases from Primary suppliers. The Very Large and Large customer volatility in the Secondary position would have been 4.7%. In contrast, volatility of the Small customers in the Primary position would have been 25.8% and their volatility in the Secondary position would have been 28.2%.
| Industry Example #2 |
Market Positive Volatility Index
Coated Paper Market
(Positive Volatility Index by Position)
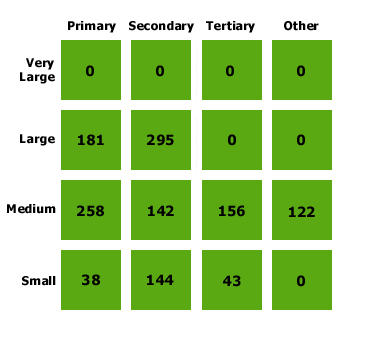
Explanation: The Very Large customers that we interviewed in this industry were not volatile. Their Positive Volatility, then, was much less than average in the marketplace. Volatility in this industry occurs primarily with the Large and Medium customers. If the industry's overall volatility were 10%, 10% of the total industry sales volume changed suppliers during the course of a year. Using the same hypothetical industry Positive Volatility of 10%, the example shows that the Large customers, in their Primary supplier relationship, would have had a volatility of 18.1%. This means that 18.1% of the total units sold by Primary suppliers to Large customers would have changed suppliers during the course of a year. These same Large customers with their Secondary suppliers would have shown a volatility of 29.5%. This means that 29.5% of the industry's sales volume in the Secondary Role with Large customers would have changed suppliers.
| Industry Example #3 |
|
Market Positive Volatility Index Commercial Printing Market |
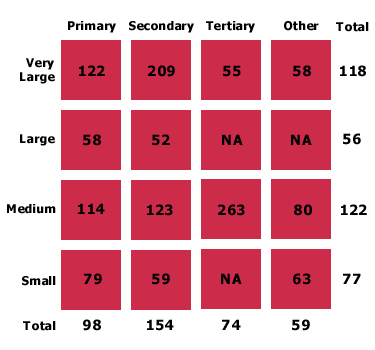
Explanation: Volatility in this industry is higher with Very Large and Medium customers than it is with Large and Small customers. It is also higher in the Secondary Role position than it is in any of the other Roles. If the industry's total Positive Volatility were 10%, 10% of the total industry sales volume during the course of a year changed from one set of suppliers to another. Using the same hypothetical industry Positive Volatility of 10%, the example shows that the Very Large customers would have shifted 12.2% of their purchases in their Primary Role position from one supplier to another. The same group of customers would have shifted 20.9% of their purchases in the Secondary Role position from one supplier to another.
| Industry Example #4 |
|
Market Positive Volatility Index Less-Than-Truckload Market |
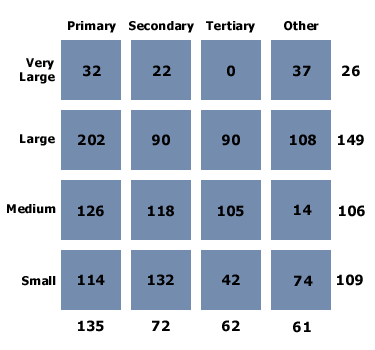
Explanation: In this industry, the Very Large customers were far less volatile than the market as a whole. At the same time, industry Positive Volatility was highest in the Primary Role position of customer relationships. If the industry had 10% of its total sales volume in Positive Volatility, then 10% of the total industry sales volume changed from one supplier to another during the course of the year. If that hypothetical 10% Positive Volatility were the average for the industry, the Very Large customers would have moved only 3.2% of their total volume purchased from Primary Role suppliers from one supplier to another. Very Large customers would have moved 2.2% of their total volume purchased from their Secondary suppliers from one supplier to another. In contrast, the Large customers would have moved 22.2% of their total purchases from their Primary Role suppliers from one supplier to another during the course of the year.
| Industry Example #5 |
|
Market Positive Volatility Index Truck Manufacturing Market |
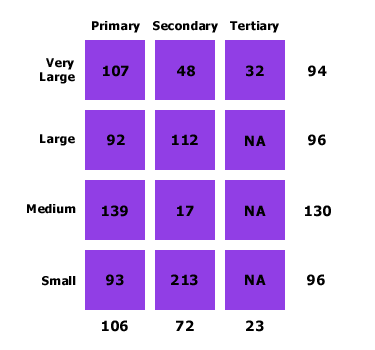
Explanation: In the Truck Manufacturing industry, Positive Volatility was highest in the Primary position and in Medium customers. If the Truck Manufacturing industry's Positive Volatility were 10% of its total sales volume, then all customers, as a group, shifted 10% of their total purchases among suppliers during the course of the year. If that hypothetical 10% were the average Positive Volatility for the industry, the Very Large customers would have shifted 10.7% of their purchases among their Primary Role suppliers, 4.8% among their Secondary Role suppliers and 3.2% among their Tertiary Role suppliers.
