Analysis 62: Sources of New Capacity
EXHIBITS:

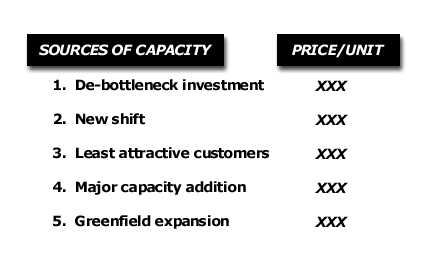
| HOW TO INTERPRET THE ANALYSIS: This exhibit arrays the sources of additional or new capacity available to a company to support the growth of its Core customers. The sources are arrayed in the approximate order of the price per unit required to justify the addition of the capacity.
The least expensive source of capacity is usually a de-bottleneck investment somewhere in the production process. This investment requires new capital and sometimes additional labor and other overhead to be invested in the process. This investment effectively expands the capacity of the entire process. The new shift would require the next lowest price per unit in order to justify its addition. This requires some new capital investment but not much compared to a major addition. Many of the other capital and other fixed costs of the company would not change. Usually, the least attractive customers in the industry fall somewhere between an investment in a new shift and a major capacity addition, such as the addition of a new line of production at an existing facility. The least attractive customers actually can become a source of new capacity for Core customers because the company can chose to withdraw the sales that it is making to these customers in order to have additional volume available to sell to its Core customers. These least attractive customers normally have a range of prices at which the company would prefer to take capacity away from them in order to support the growth of Core customers. The most expensive form of new capacity is a Greenfield expansion, where the company would build an entirely new production facility in a new location. Normally, the industry must see high rates of capacity utilization and attractive returns on investment in order to justify this kind of expansion. These conditions normally would imply a price per unit high enough that even the least attractive customers are generating enough of a return on investment to cover the company's cost of capital. PURPOSE: This analysis rank orders all the potential sources that might provide new capacity to meet the growing demand of the company's Core customers. The Company does the ranking on the basis of the average market price, through a business cycle, required to incite the capacity addition. APPROACH: The company would like to create capacity only for those customers who are likely to repay that capacity's cost, including all its capital costs, over the business cycle. This analysis arrays the options the company has to make new capacity available to its Core customers according to the unit price level, through the cycle, required to make that capacity available. The lowest cost source of new capacity is ranked first and the highest cost source is ranked last. The operations function determines the types of new capacity that might come on stream in the future. This analysis would start with the capacity-adding option that would require the lowest capital spending. It then would increase capital spending with each successive option. The marketing function determines the price equivalent value of the least attractive customers in the company's portfolio. The marketing function should estimate the price levels that the least profitable current customers pay. Any price above that level would cause the company to prefer to sell to better customers rather than these customers. The marketing staff would also estimate the amount of volume that each price level might provide to the company as it shifts sales from lower paying customers to better paying customers. In many difficult industries, the most capable competitor runs out of capacity before other competitors in the marketplace. In such a case, the leading company would reduce its relationships with its least attractive customers before embarking on major capacity additions that require prices higher than those low profit customers are paying. Return to Basic Strategy Guide Step 19 Return to Diagnose Pricing: Future Capacity |
|
Recommended Reading |
| For a greater overall perspective on this subject, we recommend the following related items:
Analyses:
Symptoms and Implications: Symptoms developing in the market that would suggest the need for this analysis.
Perspectives: Conclusions we have reached as a result of our long-term study and observations.
|
