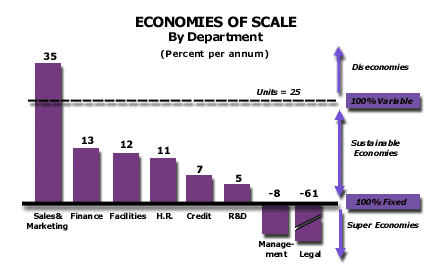
Analysis 58: Economies of Scale for Employees by Department
EXHIBITS:

| HOW TO INTERPRET THE ANALYSIS: The exhibit illustrates the People Economies of Scale in several functional cost departments of a specific company. The dotted line indicates taht customer transactions (Output) are growing at a rate of 25% a year. The vertical bars represent the FTE headcount (Input) growth rates of various functional cost departments in the company. Any growth rate in head count between zero and 25% per annum represents the creation of sustainable Economies of Scale and the potential to increase operating margins. For example, if unit sales grow at 25% a year and the Finance Department grows its head count at 13% a year, the Finance function will become a smaller cost factor per unit of sale over time. Any department with a growth rate above 25% is creating Dis-economies of Scale, which means that the larger the company becomes, the less cost effective will be that department. For example, if units grow at 25% a year, but the Sales and Marketing Department head count grows at 35%, clearly Sales and Marketing will increase its cost per unit of sale over time. Any shrinkage of an organizational unit while units of sale are growing creates Super-economies of Scale. Super-economies of Scale are not sustainable. In this exhibit, the Legal Department is shrinking at 61% per year while units are growing at 25% a year. This anomalous situation cannot continue. There is a similar story with Management, which is shrinking 8% while units grow at 25%. In this case, some people, who had formerly been considered a part of Management, were reassigned to various cost functions. This accounts for the loss in head count in Management despite unit sales growth.
PURPOSE: If the company cost structure grows more slowly than does its sales, it creates sustainable Economies of Scale. Creation of Economies of Scale enable the company both to reduce its unit costs as it grows, and to improve its cost position compared to competitors, as long as the company grows market share. This analysis measures the Economies of Scale (EOS) the company is creating, in FTE head count, as it grows its unit volume. The company uses this analysis to ensure unit costs fall as volume grows. APPROACH: This particular analysis evaluates overhead costs. Its primary thrust is the measurement of sales, general and administrative (SG&A) departments rather than costs within an operating facility. The analysis can be applied with equal vigor to an operating facility as well. To conduct this analysis, the company needs a current and past measure for Inputs, in this case People, and for Outputs. The Human Resources Department produces a measure of FTEs for each functional cost department. In turn, the departments break these FTEs into their sub-departmetns. This analysis evaluates the growth in head count (i.e., numbers if Inputs)for each key department against the growth in units of Output. The same approach applies to sub-units of each department. The analysis highlights those departments creating sustainable Economies of Scale and those who are not. The company uses this analysis as part of its effort to begin improving the Economies of Scale it creates as it grows its business. Return to Diagnose Costs: Productivity and Time |
|
Recommended Reading |
| For a greater overall perspective on this subject, we recommend the following related items:
Analyses: Symptoms and Implications: Symptoms developing in the market that would suggest the need for this analysis.
Perspectives: Conclusions we have reached as a result of our long-term study and observations.
|
