Analysis 51: Loss On Price Index
EXHIBITS:

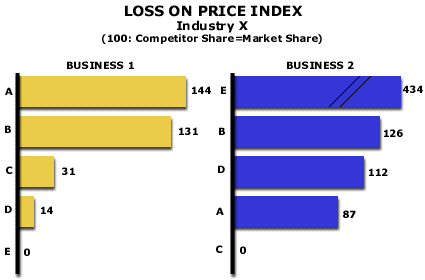
| HOW TO INTERPRET THE ANALYSIS: This exhibit displays the relative likelihood of a loss on price for competitors compared to the market average in two separate businesses. The likelihood of a loss on price is indexed to the Company's market share. In general, we would assume that a company would lose on price roughly in proportion to its market share if it were trying to price with the market. A company would be more likely to lose on price when it is willing to keep its prices higher than competition. A company would be less likely to lose share on price than its market share would suggest when it is being very aggressive in lowering its prices. Each competitor's likelihood of losing share on price is stated on an index basis where the numerator, at 100, is equal to the Company's share of the market. The dominator is the Company's share in all cases of sales losses due to price.
In Business #1, for example, if Competitor A had a market share of 20%, the exhibit would say that it lost 28.8% (20% x 1.44 = 28.85) of the share lost on price. This is a company trying to keep its price high. On the other hand, Companies D and E in Business #1 are very aggressively priced. They lost far less on price than their market share. Companies C, D and E were competing on price in their marketplace, or at least matching every low price that their customers presented. Companies A and B were reluctant to reduce their prices or they kept them higher than their competition. Business #2, on the right, shows the same kind of measures with very different results. Here, Competitor E is highly likely to lose share on price while Competitor A loses less on price than its average market share. The pricing approaches are reversed for Competitors A and E in Business #2 from those of Business #1. Competitor A will not lose share on price while Competitor E will gladly lose share on price in Business 2. PURPOSE: This analysis is used in the devlopment of the Company's pricing policy as it reveals the tactics of each competitor in the market. It arrays each competitor in the market on the likelihood of that competitor being willing to cede share to another competitor who offers the customer a lower price. APPROACH: The Company begins this analysis by creating an estimate of the annual share points that all industry competitors, in total, lose to other competitors on the basis of price. This number of share points equals 100 in the index above. An index is a measure of the performance of one entity relative to another entity. The index is the ratio of the performance of the first entity divided by the performance of the second and then multiplied by 100. An index above 100 indicates that the first entity has a higher result than the second entity. An index below 100 indicates that the first entity has a lower result than the second. The Company analyzes the share points lost on price by each competitor in the marketplace and compares that to the share points lost in the market as a whole. For example, assuming that 3 share points are given up in the market, by one set of competitors to another set on the basis of low price, 100 equals 3 share points. In the example above, Competitor A in Business 1, who lost 4.3 points of his share to a low priced competitor, would have an index of 144 (4.3 share points lost by the competitor divided by 3.0 share points lost by the whole market times 100). On the other hand, in Business 2, that same competitor lost 2.6 points of his share on the basis of price. Competitor A then has an index of 87 (2.6 share points lost by the competitor divided by 3.0 share points lost by the whole market times 100). Competitor A is using price to reduce his participation in Business 1 while he increases his presence in Business 2. Competitor E is following the opposite course. The Company would use this information in developing its pricing policy. As an illustration, the Company would tend to use a more aggressive price stance when competing against Competitor A in Business 1 while competitors D and E in that market would offer very stiff price competition, since neither competitor is likely to lose much share because someone underpriced him. Return to Diagnose Pricing: Price Sensitivity and Competition |
|
Recommended Reading |
| For a greater overall perspective on this subject, we recommend the following related items:
Analyses: Symptoms and Implications: Symptoms developing in the market that would suggest the need for this analysis.
Perspectives: Conclusions we have reached as a result of our long-term study and observations.
|
