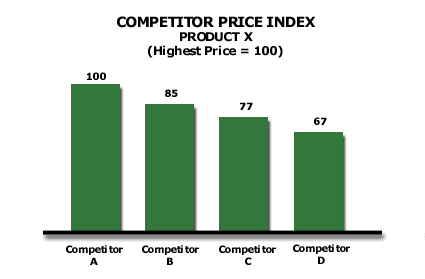
Analysis 47: Competitor Price Point Pricing Index
EXHIBITS:

| HOW TO INTERPRET THE ANALYSIS: This exhibit arrays the unit prices for each industry competitor at a particular Price Point. Each competitor's price is indexed to Competitor A, in this case, the leader in the marketplace. Each competitor, other than A, under-prices A by a significant amount. Competitor B charges a price only 85% of that of Competitor A. Competitor D is even more aggressive, charging just 67% of the price of Competitor A. This kind of a price spread is most characteristic of a Developing or a Stable market where customers are less sensitive to pricing than in a Hostile or Deteriorating market.
PURPOSE: This analysis quantifies the price differences across competitors at a given product price point, usually the Standard Leader product. This price point of each competitor has a set of benefits equivalent to that of every other competitor. APPROACH: The marketing and sales organization gathers the prices and benefit structures for each competitor. The Company arrays the product price points of each competitor according to their benefits into groups (i.e., Standard Leader, Performance Leader, Price Leader or Next Leader) with related benefits. It then compares the prices of each competitor in a given group. The Company would use these results to serve as a starting point for an analysis of growth and profitability of these competitors. The Company would test whether the lower priced competitors have high growth and low profitability. If lower priced competitors have high growth and high profitability, it is likely the industry is facing a declining price environment in the future. This analysis may also suggest the Company's entry into the high growth product price points, if it does not already compete at these price points. Return to Diagnose Pricing: Price Sensitivity and Competition |
|
Recommended Reading |
| For a greater overall perspective on this subject, we recommend the following related items:
Analyses: Symptoms and Implications: Symptoms developing in the market that would suggest the need for this analysis.
Perspectives: Conclusions we have reached as a result of our long-term study and observations.
|
