Analysis 45: Positive Volatility by Buying Criteria
EXHIBITS:

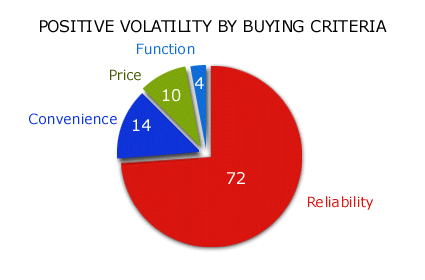
HOW TO INTERPRET THE ANALYSIS: The exhibit portrays the reasons for Positive Volatility in the marketplace. In this market, 72% of Positive Volatility is the direct result of some form of Reliability benefits that the supplier offered the customer in the Positive Volatility event. Fourteen percent of the Positive Volatility volume moved due to Convenience, while 10% moved due to Price and 4% due to Function. This exhibit would suggest three things to you. First, Function is moving relatively little share, so the company should evaluate whether its investment to create new Functions is likely to pay off. Second, Reliability does create significant Positive Volatility, much more than any other of the categories on the Customer Buying Hierarchy. This would suggest that the company should seek to be the best, or certainly among the best, in the industry on the current customer measures of Reliability. Third, the company might also conclude from this exhibit that there are occasional opportunities for a supplier to "win" market share on the basis of a low price.
PURPOSE: This analysis highlights the type of benefit, as categorized on the Customer Buying Hierarchy, that is currently moving volume in the market. It shows the market's response to innovations on the customer buying hierarchy in the recent past. It tells the company where the competition in the industry has been successful in offering something unique and uncopied for customers. APPROACH: Unless the company is able to do something dramatically different than the industry has been able to do during the period under study, it is likely that the industry will continue operating as it has in the recent past. Those benefits that have gained volume point out a potential pathway to future volume gains for the company by showing how customers view competitors' points of uniqueness. The company estimates the volume gained in the total market on the benefits listed in the Customer Buying Hierarchy Definition analysis (Analysis 44). The company should do this analysis for all positive volatility, that is, all Get In and Increase Use events in the industry. To attribute the volume movement to a category, it then divides the total volume gained through the volatility of the marketplace into the total volume gained by buying hierarchy category to obtain the share of positive volatility by hierarchy category. The company may refine this analysis further by reviewing the Positive volatility of each separate benefit that contributes to this Positive volatility. Positive Volatility by Buying Criteria: Industry Examples» Return to Diagnose Products and Services: History of Duplication |
|
Recommended Reading |
| For a greater overall perspective on this subject, we recommend the following related items:
Analyses: Symptoms and Implications: Symptoms developing in the market that would suggest the need for this analysis. Perspectives: Conclusions we have reached as a result of our long-term study and observations.
|
