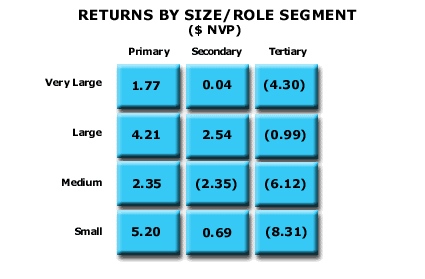
Analysis 30: Returns By Size/Role Segment
EXHIBITS:

| HOW TO INTERPRET THE ANALYSIS: This exhibit portrays the expected Net Present Value per dollar invested in acquiring an unknown new customer with a Get In event. Any segment on the matrix with a positive number is an attractive potential customer relationship, a potential Core customer. Any position on the matrix with a Negative Net Present Value is either a Near-Core or Non-Core potential customer. The company would realize a positive $1.77 Net Present Value for every dollar invested in pursuing companies in the Very Large/Primary Role segment in the industry. On the other hand, for every dollar the company would invest in pursuing a new relationship with a company in the Small Customer/Tertiary Role position it would lose $8.31. The company just clears its cost of capital in the Very Large/Secondary Role segment in the marketplace, with a Net Present Value of 4 cents per dollar invested.
PURPOSE: This analysis projects the Net Present Value of establishing a new customer relationship with a customer on which the company has little information. The company uses these classifications in developing its marketing and customer calling programs. The company also uses this analysis to evaluate the improvement in Return on Investment it would realize from a more favorable customer mix in its sales. It would use these estimates for all Get In customers where better information is not available. However, it would use specific information about any Get In customer where it can obtain more accurate data about the customer. APPROACH: The analysis uses average results by position from its survey of the marketplace. This analysis estimates the attractiveness, for the company, of the average customer relationship on the customer size/role segmentation matrix. The company estimates the average price, volume available, and cost-to-serve for the average customer in each position of the size/role segmentation matrix. In order to calculate a Net Present Value of each prospective customer relationship, the company estimates the years the relationship with the customer will last by using the experience of the marketplace to date in each Size/Role segment. It calculates its initial investment in establishing the relationship and then the profitability of each relationship over the years that it will be in the relationship. It then discounts these cash flows at the company's internal hurdle rate, or by its cost of capital, to arrive at a Net Present Value. The company then makes a preliminary classification of each segment on the matrix. Any segment that offers a positive Net Present Value is a potential Core customer segment for the company. If the Net Present Value of any segment is negative, the company must make a further determination of whether the average segment is a Near-Core or Non-Core type of relationship. It then classifies Near-Core customers into potential target customers and Non-Core customer positions into Opportunistic customers. Elimination of Unattractive Customers Examples » Return to Diagnose Costs: Increasing Margins by Improving Customer Mix |
|
Recommended Reading |
| For a greater overall perspective on this subject, we recommend the following related items:
Analyses:
Symptoms and Implications: Symptoms developing in the market that would suggest the need for this analysis. Perspectives: Conclusions we have reached as a result of our long-term study and observations.
|
