Analysis 18: Positive Volatility by Position
EXHIBITS:

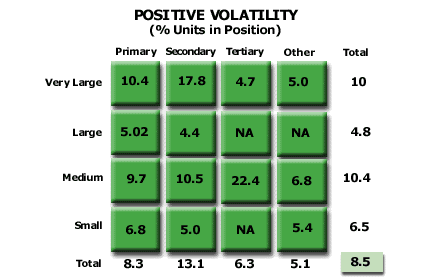
| HOW TO INTERPRET THE ANALYSIS: In each year, 8.5% of the units in this industry changed suppliers. The Very Large and Medium customers were more Volatile than the average in the marketplace, while the Large and Small customer size segments were less Volatile than the average. The most Volatile Role in the market was the Secondary, where 13.1% of all the units sold in the Secondary position changed suppliers.
PURPOSE: This analysis quantifies the percentage unit volatility during a period of time for each position on the size/role customer segmentation matrix. APPROACH: This analysis is the result of work done on the sample of customers analyzed by the company. The company quantifies the amount of volume that change suppliers in each position on the size/role matrix during the period under study. The company then divides this volatile volume by the total volume purchased in the position during the period to arrive at the percentage volatility figure. Return to Diagnose Segments: Industry Volatility |
|
Recommended Reading |
| For a greater overall perspective on this subject, we recommend the following related items:
Analyses:
Symptoms and Implications: Symptoms developing in the market that would suggest the need for this analysis.
Perspectives: Conclusions we have reached as a result of our long-term study and observations.
|
