Analysis 16: Positive Volatility Across the Industry
EXHIBITS:

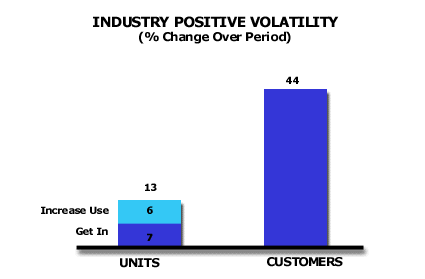
| HOW TO INTERPRET THE ANALYSIS: In this industry, customers were far more Volatile than were total units. This means that many customers changed their suppliers but they shifted relatively few units among suppliers. Thirteen percent of the units in this industry changed suppliers. This 13% unit change was made by 44% of the customers. Of the 13% Positive Volatility in the industry, Get In represented 7% of the total 13% industry Volatility while Increase Use represented the other 6%. The implications of this result are either that many Small and Medium sized customers were the ones changing their suppliers or that when a customer changed a supplier he moved volume from a Primary supplier to a Secondary supplier or vice versa, that is, between suppliers who were relatively close in total sales to the customer.
PURPOSE: This analysis tells the company how much volume is available to change suppliers during a given period. Unless the conditions in the industry change, the company can plan on that percentage of volume moving during a similar planning period. This total volatility in the market is the volume base available for the company to exploit to raise its share. APPROACH: To achieve this analysis, the company should conduct a sample of all customers in the marketplace to determine the customers who change suppliers and the amount of volume they change in each change event. The analysis focuses on positive volatility, that is, Get In and Increase Use, for the industry as a whole. The company then scales up these sample results to estimate positive volatility in the total industry. In a fast growing industry, the period of study probably should be no longer than one year. Slower growing industries might use 3 year periods. The analysis covers both the units of volume moved, as well as the percentage of customers who moved. The units moved are further divided into those units that are the result of a Get In event and those that are the result of an Increase Use event. This gives a further definition to the type of volume available to competitors in the market. The company could also conduct a similar analysis for negative volatility, that is, Decrease Use and Get Out events. Unless there are many customers entering or leaving the market, the negative volatility percentage will be about the same as that for the positive volatility. As the company conducts an analysis of negative volatility in the industry, it prepares to examine its own performance on negative volatility compared to the industry as a whole. Return to Diagnose Segments: Industry Volatility |
|
Recommended Reading |
| For a greater overall perspective on this subject, we recommend the following related items:
Analyses:
Symptoms and Implications: Symptoms developing in the market that would suggest the need for this analysis.
Perspectives: Conclusions we have reached as a result of our long-term study and observations.
|
