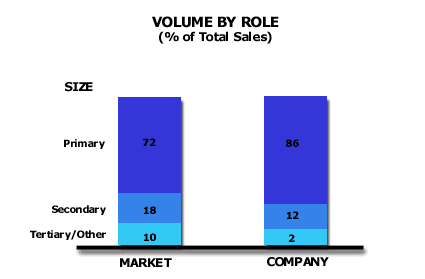
Analysis 11: Company Compared to Market in Volume by Role
EXHIBITS:

| HOW TO INTERPRET THE ANALYSIS: Explanation: The two bar charts display the percentage of total sales that the market and the company have in the Primary, Secondary and Tertiary/Other Roles in the marketplace. This company is very strong in its market. It sells 86% of its sales into the Primary Role position with its customers. This compares to 72% for the average competitor in the market.
PURPOSE: This analysis tells the company how it performs relative to the average competitor in obtaining volume in the primary and secondary positions in customer relationships. APPROACH: The company conducts this analysis by summing its total volume by each position in all of its customer relationships and then dividing that volume by the total volume sold in order to arrive at a percentage of volume by role. A similar analysis conducted for the market produces the market's volume by role. The company would use this analysis to evaluate its program compared to others in the marketplace. The more primary relationships a company has, the stronger is its market position. The company position becomes stronger still if these relationships are with VL and L customers. In the example above, the company offers a much stronger program than the average competitor for primary relationships. This is a profile of a strong leader in the market. A follower, and smaller companies in the market, will tend to have higher percentages than the market in secondary roles and below. |
|
Recommended Reading |
| For a greater overall perspective on this subject, we recommend the following related items:
Analyses: Symptoms and Implications: Symptoms developing in the market that would suggest the need for this analysis.
Perspectives: Conclusions we have reached as a result of our long-term study and observations.
|
